This week’s BEACON Researchers at Work post is by MSU graduate student Carina Baskett. Carina blogs at Wandering Nature.
Here in Michigan, the hummingbirds are coming back for the summer. If you see one, it’s likely a Ruby-Throated, since it’s the only common hummingbird here. Within the continental US, there are 17 species of hummingbirds, compared with 51 in Costa Rica, and 127 in Peru. The numbers for global tree distributions are even more amazing: there are over 22,000 species of trees in the Amazon, and only 620 in the US and Canada.
![]() This pattern of higher species diversity in the tropics is ubiquitous across many types of organisms, across the globe, and throughout the fossil record. The reason these numbers surprise and interest me is that we don’t really know why the tropics house so much of Earth’s biodiversity. Sure, there are hypotheses (in fact, over 100!), but we’re not very close to agreeing on which ones are more or less correct.
This pattern of higher species diversity in the tropics is ubiquitous across many types of organisms, across the globe, and throughout the fossil record. The reason these numbers surprise and interest me is that we don’t really know why the tropics house so much of Earth’s biodiversity. Sure, there are hypotheses (in fact, over 100!), but we’re not very close to agreeing on which ones are more or less correct.
I think our inability to explain this pattern highlights a gap in our understanding of biological processes. It’s a difficult question to answer because the scale of time and space is enormous. To experimentally test some of the hypotheses, we would need other Earths and many millions of years!
One of the early ideas to explain high tropical diversity focused on how temperate and tropical environments could differentially influence evolution. Theodosius Dobzhansky said in 1950 that, “Any differences between tropical and temperate organisms must be the outcome of differences in evolutionary patterns.” (Dobzhansky would say that! His quote, “Nothing in biology makes sense except in the light of evolution,” is practically a required first slide in any class that mentions evolution.)
Specifically, by differences in evolutionary patterns, he means that species are formed at higher rates in the tropics. Why and how? The idea has two parts. The first is that interactions between species (like pollination, competition, or diseases) are more intense in the tropics because of a lack of evolutionary pressure from harsh winter weather.
Intense tropical herbivory
For example, as any tropical traveler knows, you need more than sunscreen to get ready for a trip to the equator. You need shots and medicine to prevent typhoid, yellow fever, and malaria. You need to budget for plenty of bottled water, and whatever you do, don’t eat the lettuce. These precautions aren’t just because of a lack of sanitation in tropical countries. Human diseases and parasites are actually more diverse and severe closer to the equator.
Species could form at higher rates in a region with more intense species interactions because the players in an interaction can evolve, while the weather, which is the main environmental challenge in a place like Michigan, cannot.
The great tropical ecologist Dan Janzen stated this succinctly when he said, “The winter experienced by a northern pine or oak has probably not changed in the past 60 million years, nor has the good solution to its challenge; the [biological] challenge to a rainforest [tree] Dipteryx panamensis most decidedly has changed.”
Imagine if two populations of Dipteryx panamensis were separated from each other for 10 million years, and the main challenge in each location is a fungal disease. Even if the fungus starts out the same in each locale, it will quickly change as the trees in each place evolve different ways to resist it, and the fungi evolve different counter-attack strategies. The two tree populations might have changed so much as to be unrecognizable to each other after 10 million years—that is, they will have become two separate species—compared to two populations of white oak, whose main challenge is the unchanging winter.
Dobzhansky’s idea has been relatively under-studied. Scientists have focused more on testing ecological and historical explanations for global diversity patterns, rather than evolutionary explanations. But something is missing, because the answer still eludes us.
Existing evidence is not sufficient to say whether Dobzhansky was right, but nor has his idea been disproven. Some recent studies, using both fossils and evolutionary family trees, have found patterns of higher speciation rates in the tropics. There are studies showing that species interactions are more “intense” in the tropics, but it’s a difficult concept to define and measure, and there is not yet enough data to conclude anything definitive. Whether or not evolutionary outcomes driven by species interactions are somehow different from those driven by the weather is almost completely unknown. With my dissertation, I am trying to test these latter two parts of the hypothesis.
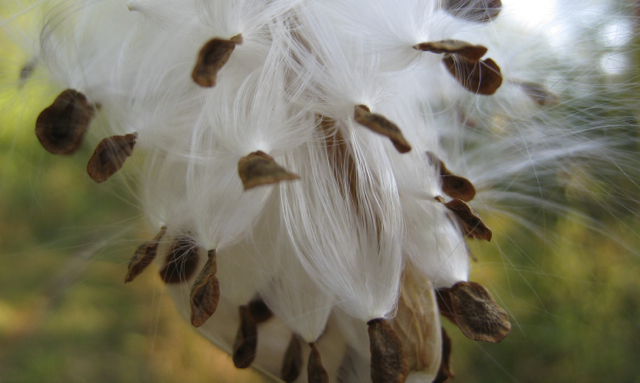
Pokeweed in common garden at Kellogg Biological Station
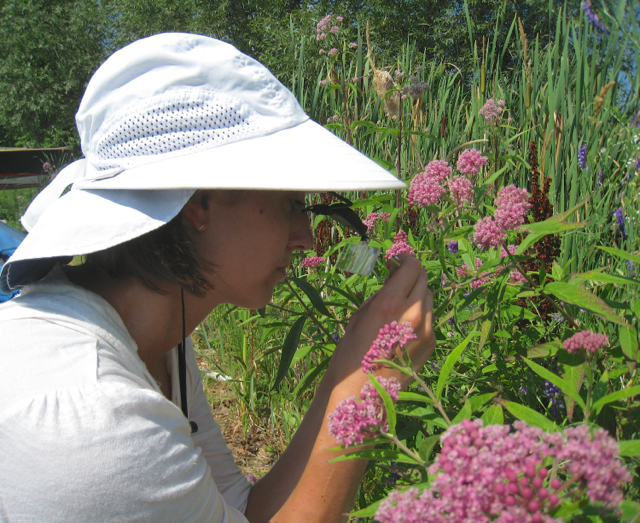
I did a preliminary study of whether pokeweed, Phytolacca, is more reliant on pollinators at lower latitudes. To test this, I planted seeds near MSU from the temperate Phytolacca americana that were collected from southern Florida, northern Florida, Tennessee, and Michigan. I also planted some seeds from its close relative Phytolacca rivinoides, which lives in Central America. The lower-latitude plants invested more in pollinator attraction and reward. They had bigger flowers and larger overall floral displays, and they produced more nectar. Soon, I’ll head out to the field to make similar measurements on pokeweed in natural populations.
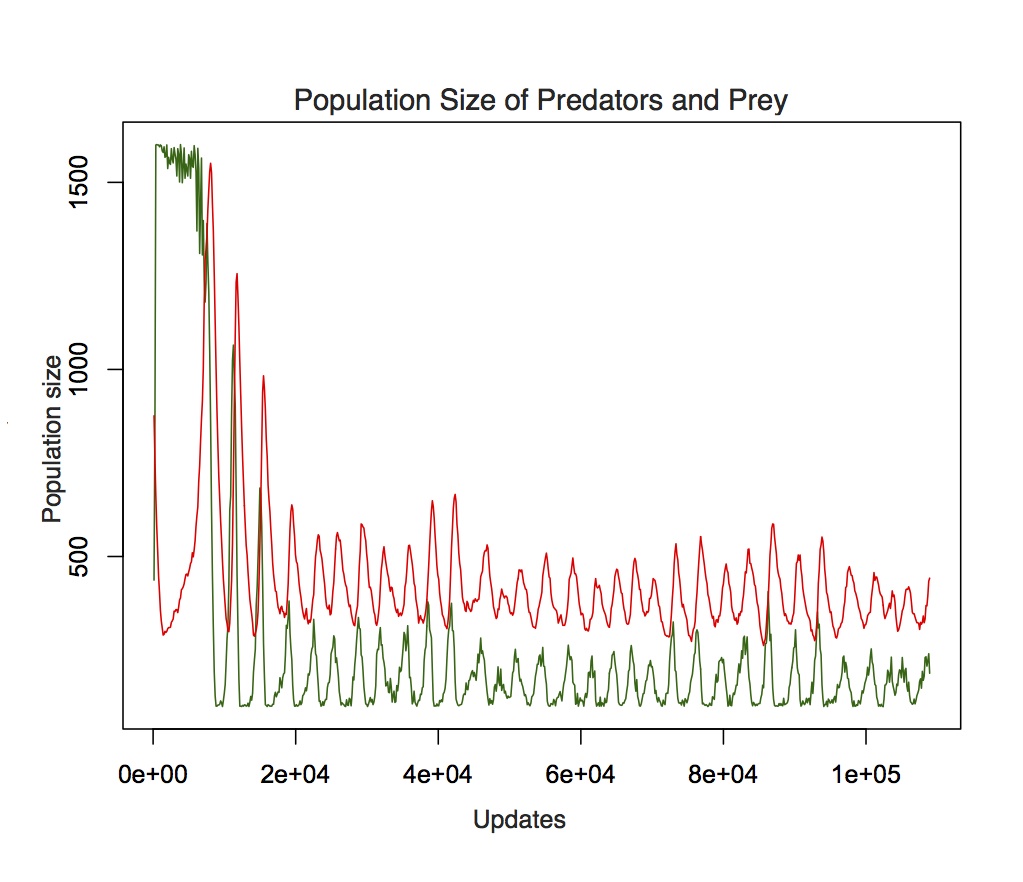
To test the idea that evolutionary outcomes differ depending on whether the main evolutionary challenge can evolve or not, I’m collaborating with current and former BEACON students and professors on an experimental evolution project in the lab, using bacteria, viruses, and antibiotics.
Phytolacca americana (pokeweed) fruits
I realize that my dissertation isn’t going to solve the mystery of why the tropics are so diverse, but I’m excited to chip away at it, now that we have new tools to test Dobzhansky’s idea from 1950. It’s also important to understand how the tropics might differ, in terms of ecology and evolution, from the temperate zone. Most conservation and restoration research takes place in the temperate zone. What if the lessons we’ve learned about conservation here don’t translate to the tropics?
Compared to working in a lab with bacteria that I can’t see, I’m much more comfortable in the rainforest, even with its venomous snakes and unbearable heat. But I’m looking forward to learning my way around the petri plates and Bunsen burners—as long as I get to spend some time each year in the tropics, getting an intense dose of biodiversity (but hopef
ully not parasites).
For more information about Carina’s work, you can contact her at baskettc at msu dot edu.